2c5b9e182b34e151f125258ddd39c720b70702e1
Pretty bare bones but gets the job done, unlike the gcc
tooling, this will work for release builds, the performance cost
of it is on the high side of things, the full test suite tests take over
an hour for me with code coverage support enabled on a release build.
I have not timed a debug build. Given developers can just run their
tests to get coverage data over what they are working on, I feel this
is still useful tooling to have.

This adds the 3 targets for clang and adds a single gcc target

coverage-reset - this removes the collected code coverage data and
report

coverage-report - This merges the collected data and generates the
report (new for gcc)

coverage-show - This merges the collected data and generates the report
and opens it in the browser

This relies on llvm-cov and llvm-profdata being available if not found
code coverage is disabled.

Note: A full test run requires an obscene amount of disk space, a
complete test run takes about 125GB and takes 12 minutes to merge, so
provision the COMPILER_CODE_COVERAGE_DATA_DIR folder accordingly

Example report in PR
…
Blender
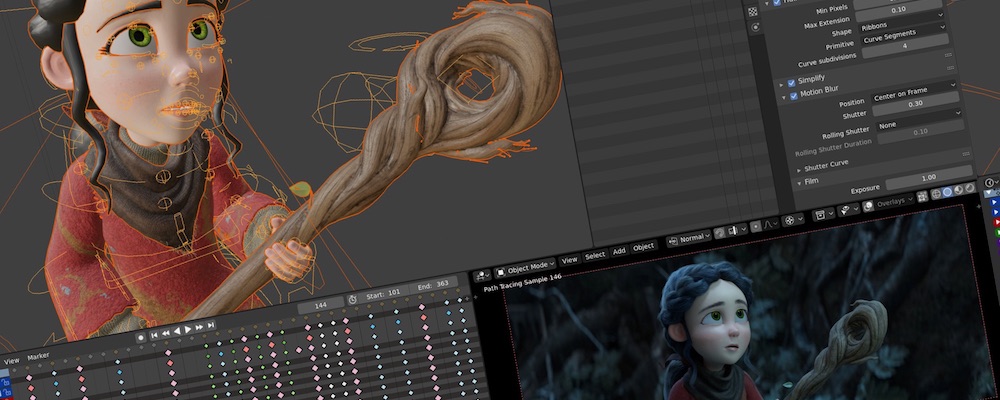
Blender is the free and open source 3D creation suite. It supports the entirety of the 3D pipeline—modeling, rigging, animation, simulation, rendering, compositing, motion tracking and video editing.
Project Pages
Development
License
Blender as a whole is licensed under the GNU General Public License, Version 3. Individual files may have a different but compatible license.
See blender.org/about/license for details.
Description
Languages
C++
78%
Python
14.9%
C
2.9%
GLSL
1.9%
CMake
1.2%
Other
0.9%
